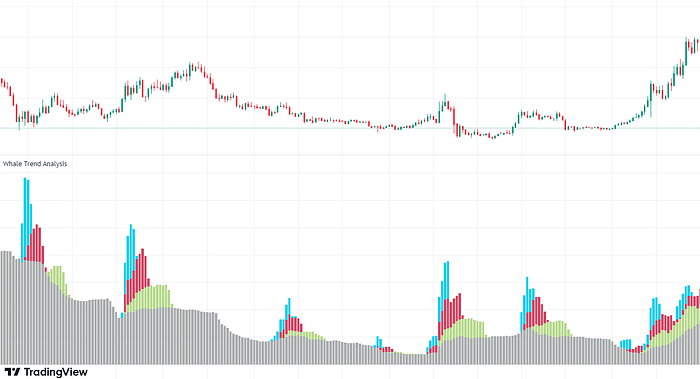
🐋Whale Trend Analysis
I. Basic Information
Indicator Name: Whale Trend Analysis
Type: Participant Structure Classification
Description: By utilizing calculations based on trading volume and size distribution, coupled with AI algorithms, this analysis discerns transaction amounts across different scales. It dissects trading volume into four dimensions: institutional investors, market whales, significant traders, and retail participants. This method effectively reveals the trading patterns of major market participants.
II. Usage
Bar Colors:

“Light Blue Bars”: Represent the trading volume of institutional investors.
“Red Bars”: Represent the trading volume of market whales.
“Green Bars”: Represent the trading volume of significant traders.
“Gray Bars”: Represent the trading volume of retail participants.
III. Application Techniques
Applicability: Suitable for any market conditions.
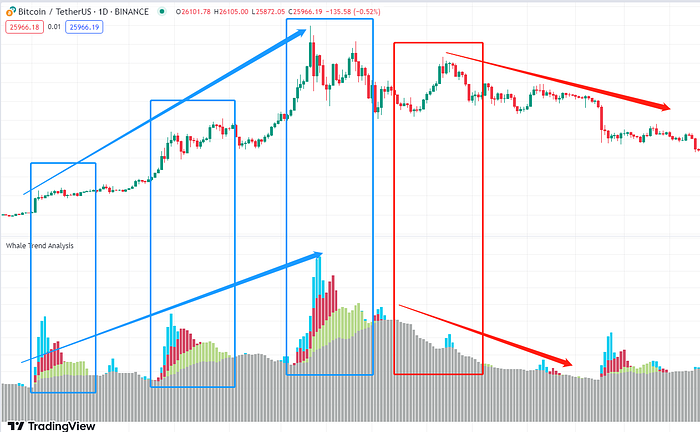
Identifying Trends: When the market is on the rise and there are bars representing institutional investors and market whales, it indicates strong buying intentions. However, if the market continues to rise but these bars disappear, it’s possible that only retail participants are actively trading, while institutional investors and market whales may be quietly exiting. In such a scenario, caution is advised to avoid being taken advantage of.

Last updated