⛰️Momentum Eruption
I. Basic Information
Indicator Name: Momentum Eruption
Type: Momentum Indicator
Description: Combining the distribution of average transaction prices with corresponding trade volumes and utilizing AI algorithms to detect short to medium-term support and resistance within trends. This indicator aims to calculate critical points for price rebounds or pullbacks. When following a trend, long positions are initiated at pullback extremes, while short positions are taken at rebound extremes.
II. Usage
Moving Averages:
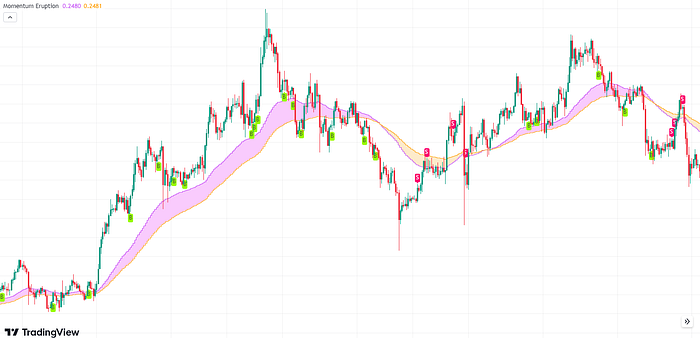
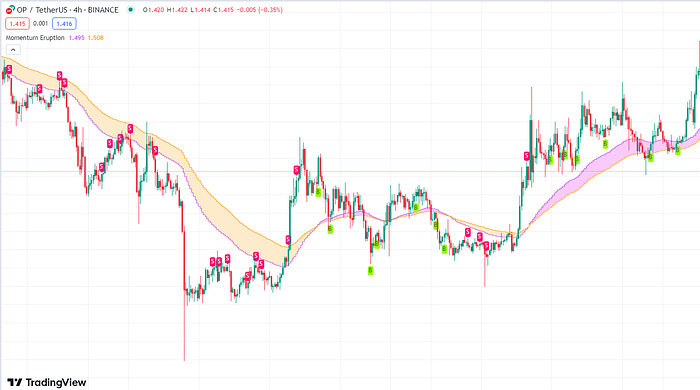
“Moving Averages”: Represent the direction of trend development and act as support and resistance.
2. Signals:

“B”: Indicates a long buy signal.
“S”: Indicates a short sell signal.
III. Application Techniques
Applicability: Suitable for trending markets.
Signals: When the moving averages are upward trending, and a certain trend is established, it is considered a bullish direction. When a “B” signal appears, consider entering a long position. When a certain level of profit is achieved, consider taking profit, such as reaching a previous high. For “S” signals, the usage is similar but opposite.

3. Opportunities: Since markets tend to move in cycles, this indicator provides many signals during trending conditions. Each signal should be independently observed and used, and there is no specific guidance on closing or taking profits for each signal.


Last updated