📊KD Momentum Matrix
Indicator: KD Momentum Matrix
Indicator Type: Momentum Indicator
Description: The KD Momentum Matrix, a cutting-edge short-term momentum indicator, harnesses innovative KD algorithms to offer a novel approach to identifying trends. This indicator facilitates the recognition of points where bullish and bearish momentum within a trend is either intensifying or waning, thereby empowering traders to optimize their profit-taking strategies.
Indicator Appearance:
Volatility Variation:
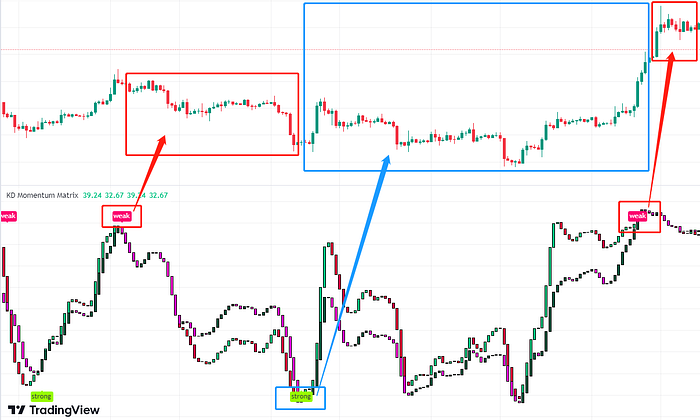
“Strong”: This indicator signifies an imminent rise in potential volatility, implying that larger price fluctuations are likely in the near term.
“Weak”: Conversely, the “Weak” indicator points to an impending decrease in potential volatility, indicating that price fluctuations are expected to be less pronounced in the near future.

Long-Term Momentum:
Blue Bars: Represent the strengthening of bullish momentum and the weakening of bearish momentum.
Purple Bars: Indicate the strengthening of bearish momentum and the fading of bullish momentum.
Trading Strategy: During an uptrend, consider long positions when bullish momentum strengthens and bearish momentum weakens; for downtrends, the opposite applies.

Short-Term Trend Change:
Green Bars: Signal the intensification of bullish momentum and the decline of bearish momentum.
Red Bars: Indicate the strengthening of bearish momentum and the waning of bullish momentum.
Trading Strategy: Align your positions with the short-term momentum. Strengthening bullish momentum and weakening bearish momentum suggest long positions, while the opposite is true for short positions.

Application Tips:
1. Suitable for Short-Term Trading:
The KD Momentum Matrix is exceptionally effective for short-term trading due to its accurate indication capabilities.
2. Capitalizing on Opportunities:
During consolidation phases, closely monitor “strong” indications, as they imply heightened volatility. Keep an eye on the changing colours of both long-term and short-term momentum bars. In uptrends, consider long positions, and in downtrends, consider short positions.
3. Exercise Caution:
“Weak” indications during short-term trends may hint at an upcoming correction or trend exhaustion. When the indicator is “weak,” adapt your positions accordingly and capitalize on momentum bar signals to secure profits.
4. Detecting Divergence:
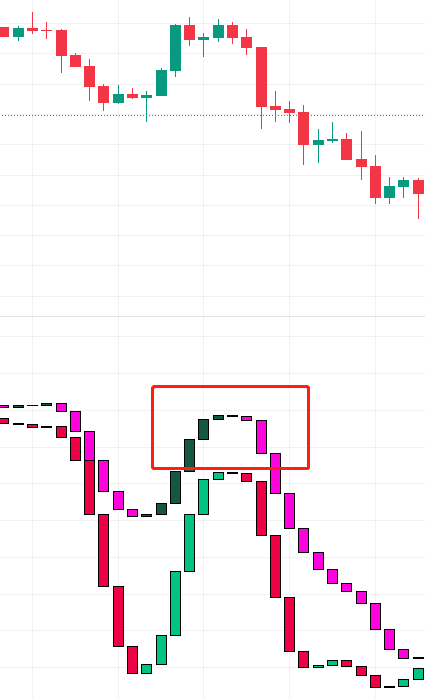
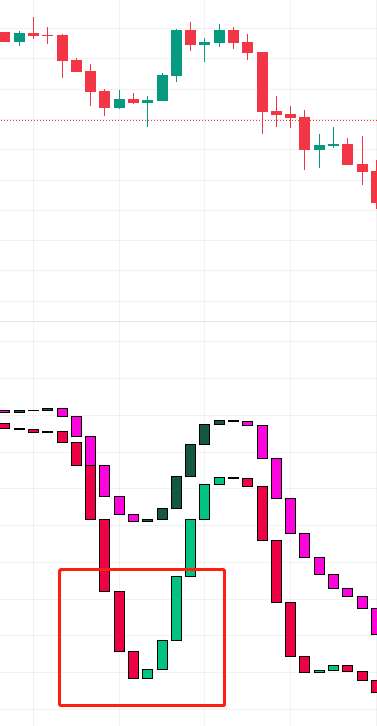
While long-term and short-term momentum bars usually align, differences may occasionally arise, particularly in volume. Exercise prudence in such scenarios, such as when short-term momentum suggests bullishness while long-term momentum remains bearish. Wait for additional confirmation as subsequent price movements may uphold the ongoing downtrend.
Last updated