📈Trend Sentinel Barrier
Indicator: Trend Sentinel Barrier
Indicator Type: Trend Indicator
Description: The Trend Sentinel Barrier leverages cutting-edge technology to discern trend directions and capitalize on market dynamics by meticulously accumulating the cumulative volume of both bullish and bearish movements. Its sophisticated algorithm calculates short-term average costs, meticulously gauging the turnovers of both bullish and bearish forces. The result is a trend indicator that distinguishes genuine trends from false signals.
Indicator Appearance:
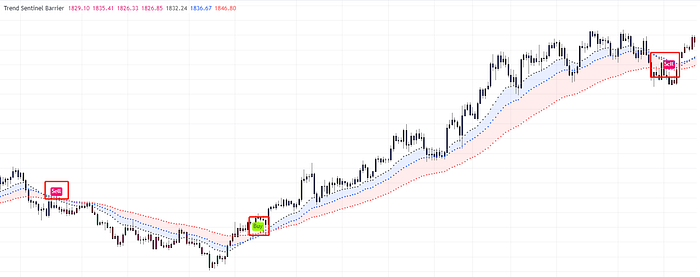
Signal Direction: The Trend Sentinel Barrier is designed to communicate with clarity. A “BUY” signal unequivocally denotes a bullish trend, while a “SELL” signal indicates the emergence of a bearish trend.

Support and Resistance Zones: The indicator introduces two distinct zones for better precision. The “Light Blue Zone” signifies short-term dynamic costs, offering subtle support or resistance. In contrast, the “Light Red Zone” represents medium- to long-term dynamic costs, unearthing robust support or resistance levels.

Application Tips:
1. Trend Identification and Profit Security:
In the realm of trending markets, the Trend Sentinel Barrier proves invaluable. Its ability to pinpoint trends equips traders with a strategic advantage to enhance profit margins.
2. Directional Insight:
During phases of heightened market volatility, the “BUY” signal indicates an unfolding bullish trend. This signal provides the green light for opening long positions. To refine your strategy, consider synchronizing your moves with momentum indicators that mirror bullish sentiment. Conversely, a “SELL” signal sets the stage for an emerging bearish trend.
3. Breakout Opportunities:
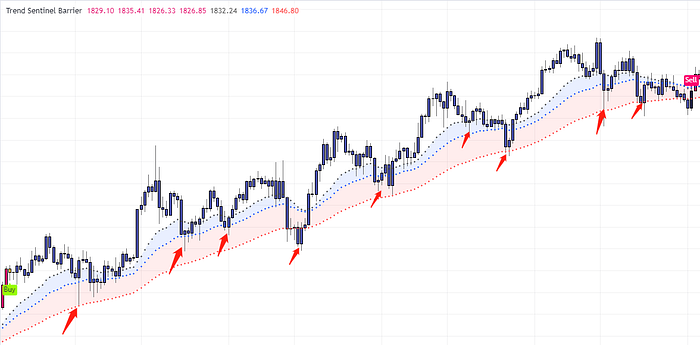
Upon receiving the directional signal, the focus shifts to the “blue area” and the “red area,” denoting short-term and medium- to long-term dynamic costs, respectively. These zones underscore resilient support and resistance levels. For instance, during an uptrend, if the price retraces but finds a firm foothold within these areas without succumbing to breakdowns, it signals a robust defence against bearish forces. This may not be an opportune juncture to augment long positions.
Nonetheless, a decisive breakout can usher in a strategic window for bolstering long positions. A word of caution: if consecutive breakouts are elusive, prudent profit-taking strategies come into play. In these instances, consider reentering positions based on momentum indicators as prices regress to the “blue area” and “red area.”
Last updated